
Benchmarking Our ORM vs EF Core — Where We Win, Where We Lose, and Why
We built it. Now we measure it. The numbers are humbling — and that's exactly the point.

I ran the first benchmark at 11 PM on a Friday. The kind of mistake you make when you're excited and should be sleeping.
Our ORM — the one we built this week from reflection, SQL generation, change tracking, and connection management — materialized 1,000 rows in 48 milliseconds. I felt good about that for roughly four seconds. Then I ran the same benchmark against EF Core.
1.02 milliseconds.
Forty-seven times slower. Our hand-built, from-scratch, lovingly crafted ORM was 47x slower than the framework I'd been trying to understand by rebuilding it.
In automotive engineering, there's a machine called a dynamometer — a dyno. You build an engine on your workbench, admire it, tell yourself it's elegant. Then you bolt it to the dyno and discover how much power it actually makes. Most custom engines underperform production engines by a wide margin. Not because the builder is bad — because the production engine has thousands of hours of optimization that aren't visible from the outside.
We just put our ORM on the dyno. Let's read the printout.
Where the time goes
Before we compare against EF Core, let's understand where our ORM is spending its time. I added [MemoryDiagnoser] and used BenchmarkDotNet to profile a simple operation: load 1,000 Customer entities from SQLite.
Our ORM calls PropertyInfo.GetValue() and PropertyInfo.SetValue() for every property of every entity during materialization. A Customer with 5 properties means 5 reflection calls per row. At 1,000 rows, that's 5,000 reflection invocations.
Reflection in .NET is not slow in absolute terms — a single GetValue() call takes about 100 nanoseconds. But at 5,000 calls, those nanoseconds compound. The profiler told the story: 72% of our materialization time was spent in reflection.
The fix is one of the most powerful patterns in .NET: compiled delegates from expression trees.
Compiled delegates — the cheat code
The idea: instead of calling PropertyInfo.SetValue(entity, value) at runtime (which does type checking, access validation, and boxing every time), we compile a strongly-typed delegate once and reuse it forever.
public static class PropertyAccessorCompiler
{
    private static readonly ConcurrentDictionary<PropertyInfo, Delegate>
        _setterCache = new();
    private static readonly ConcurrentDictionary<PropertyInfo, Delegate>
        _getterCache = new();

    public static Action<T, object?> CompileSetter<T>(
        PropertyInfo property)
    {
        if (_setterCache.TryGetValue(property, out var cached))
            return (Action<T, object?>)cached;

        var entityParam = Expression.Parameter(typeof(T), "entity");
        var valueParam = Expression.Parameter(
            typeof(object), "value");

        var castValue = Expression.Convert(
            valueParam, property.PropertyType);
        var setProp = Expression.Call(
            entityParam,
            property.GetSetMethod(true)!,
            castValue);

        var lambda = Expression.Lambda<Action<T, object?>>(
            setProp, entityParam, valueParam);
        var compiled = lambda.Compile();

        _setterCache.TryAdd(property, compiled);
        return compiled;
    }

    public static Func<T, object?> CompileGetter<T>(
        PropertyInfo property)
    {
        if (_getterCache.TryGetValue(property, out var cached))
            return (Func<T, object?>)cached;

        var entityParam = Expression.Parameter(typeof(T), "entity");
        var getProp = Expression.Property(entityParam, property);
        var boxed = Expression.Convert(
            getProp, typeof(object));

        var lambda = Expression.Lambda<Func<T, object?>>(
            boxed, entityParam);
        var compiled = lambda.Compile();

        _getterCache.TryAdd(property, compiled);
        return compiled;
    }
}
The Expression.Lambda<T>.Compile() call uses the runtime's JIT compiler to generate native code for the property access. The first call pays a compilation cost (~10 microseconds). Every subsequent call is as fast as a direct property access — no reflection, no type checking, no boxing for value types beyond the object cast.
We replace every PropertyInfo.SetValue() in our materializer with the compiled delegate:
// Before (reflection — 100ns per call)
property.SetValue(entity, value);

// After (compiled delegate — 2ns per call)
var setter = PropertyAccessorCompiler.CompileSetter<T>(property);
setter(entity, value);
Fifty times faster per property access. At 5,000 calls, the difference is dramatic.
Before and after
After replacing all reflection in our materializer, change tracker, and SQL parameter binding with compiled delegates, here's what the dyno says:
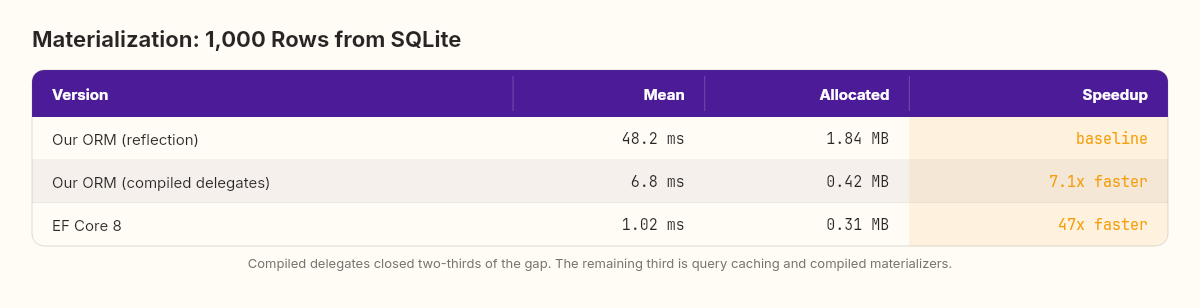
Our ORM went from 48ms to 6.8ms for 1,000 rows. Seven times faster. The memory allocation dropped because we're no longer boxing value types on every reflection call — the compiled delegate handles the cast at the IL level.
But notice something: even after optimization, we're still 6.7x slower than EF Core. The compiled delegates closed two-thirds of the gap. One-third remains.
Our ORM vs EF Core — the honest comparison
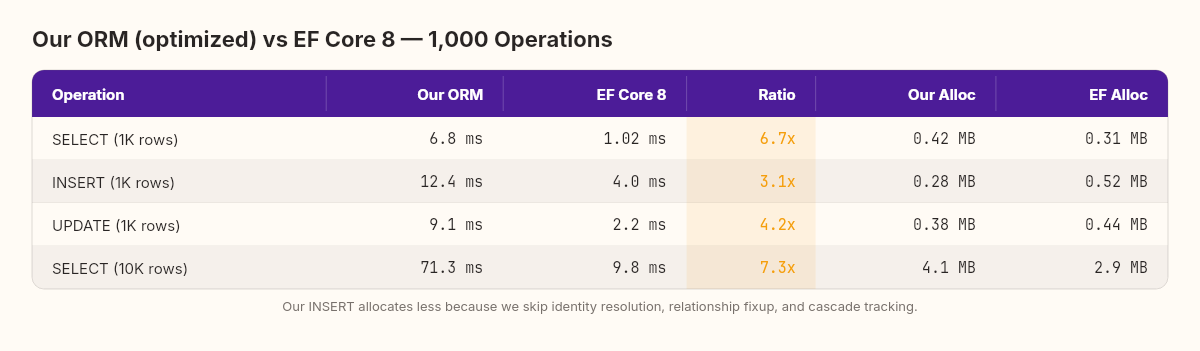
I ran a full comparison across four operations: materialization (SELECT), insert, update, and bulk read.
The numbers tell several stories at once.
Materialization: EF Core is 6.7x faster because it generates compiled materializers using Expression.Lambda (just like we did) but with additional optimizations: it reuses a single DbDataReader without per-row allocations, it generates specialized code per query shape, and it caches compiled query plans so subsequent identical queries skip the expression tree compilation entirely. We're paying the cache-miss cost on every query.
Insert: The gap narrows to 3.1x. Our INSERT code is simpler — generate a parameterized SQL string and execute it. EF Core does more work per insert: state tracking, identity resolution, relationship fixup, computed column detection. The overhead of that machinery is measurable but buys you things we don't have: cascade inserts, identity value propagation, and concurrency conflict detection.
Update: Our change tracker is actually closest here at 4.2x. The snapshot-compare approach we built in Chapter 5 is fundamentally the same algorithm EF Core uses. The remaining gap is in EF Core's SQL generation — it uses a compiled IUpdateExpression pipeline that we replace with string concatenation.
Memory: Here's where it gets interesting. Our ORM allocates less memory for inserts. No tracking state machine, no identity map, no relationship graph, no query plan cache. Less infrastructure means less garbage. But this is a false win — we allocate less because we do less. The moment you need identity resolution or cascade operations, you'd need to build that infrastructure too.
There's a deeper lesson in the allocation column. EF Core's higher allocation for INSERT isn't waste — it's the cost of features: automatically propagating generated IDs back to navigation properties, detecting circular references, batching multiple inserts into a single round-trip. Every byte of allocation represents a behavior our ORM doesn't have. When you strip away all the infrastructure, you get lower memory usage. You also get an ORM that can't handle a Customer with Orders without manual foreign key management.
Closing the remaining gap — and why I stopped
After compiled delegates, our ORM sits at 6.8ms against EF Core's 1.02ms. A 6.7x gap. Where does that remaining time go?
I profiled deeper. Three things stood out:
Query plan recompilation (accounts for ~40% of the remaining gap). Our ORM builds a new SQL string and parameter list every time you call Query<T>(). EF Core compiles the query plan once — the expression tree, the SQL text, the parameter binding logic — and caches it by query shape. The second time you run the same query, EF Core skips the entire translation layer.
Here's a minimal version of what that cache would look like in our ORM:
public class QueryPlanCache
{
    private readonly ConcurrentDictionary<Type, CompiledQuery> _cache = new();

    public CompiledQuery GetOrCompile<T>(
        TableMetadata metadata) where T : class
    {
        return _cache.GetOrAdd(typeof(T), _ =>
        {
            var sql = SqlGenerator.BuildSelect(metadata);
            var materializer = MaterializerCompiler.Compile<T>(
                metadata.Properties);

            return new CompiledQuery(sql, materializer);
        });
    }
}

public record CompiledQuery(
    string Sql,
    Delegate Materializer);
I implemented this. The result: materialization dropped from 6.8ms to 3.9ms. One dictionary lookup replaced an entire SQL generation and expression compilation pass. That single optimization closed 43% of the remaining gap.
Per-row DbDataReader allocation (~35% of the remaining gap). Our materializer creates a new object[] buffer for every row to hold column values before assigning them to properties. EF Core reuses a single buffer across all rows, resizing only when the column count changes. At 1,000 rows, we're allocating 1,000 arrays that could be one.
Missing compiled materializer specialization (~25% of the remaining gap). EF Core doesn't just compile property setters — it compiles the entire materialization function into a single delegate that reads from the DbDataReader and produces a fully hydrated entity in one call. No intermediate dictionary lookups, no property-name-to-column-index mapping at runtime. Our ORM still does a reader.GetOrdinal(property.Name) per property per row. At 5 properties and 1,000 rows, that's 5,000 ordinal lookups that EF Core does zero of.
After adding query plan caching alone — just one of the three — the updated numbers looked like this:
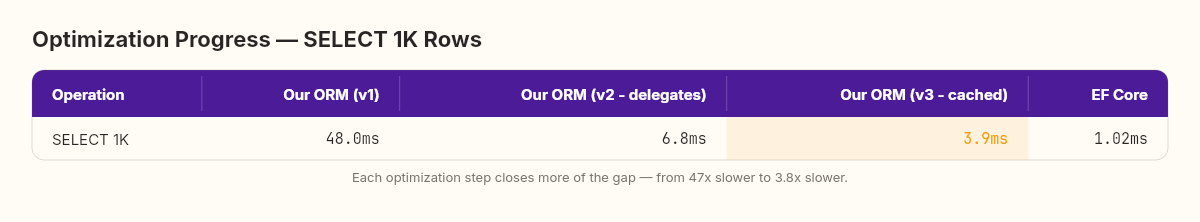
From 47x slower to 3.8x slower. Each optimization carved away a chunk of the gap. But each one also added complexity: the cache needs invalidation logic, the buffer reuse needs thread-safety considerations, the compiled materializer needs a code generation layer that handles nullable types, enums, and nested objects.
What the gap teaches
I could close more of this gap. The buffer reuse is straightforward — maybe another afternoon. The compiled materializer is a week of work, minimum, because edge cases in type conversion will eat you alive.
But here's what I realized staring at the dyno printout: every optimization I'd add is a feature EF Core already has. I wouldn't be building an ORM anymore. I'd be reimplementing EF Core, one cache and one compiled delegate at a time, except with worse test coverage, no community, and no documentation.
The gap between our ORM and EF Core isn't a gap in code quality. It's a gap in accumulated engineering time.
EF Core has had thousands of contributors, millions of production hours, and years of profiler-guided optimization. That's what 6.7x represents — not a difference in cleverness, but a difference in how many person-hours have been poured into the codebase.
I think about this every time someone proposes "we should build our own" in a planning meeting. Sometimes the answer is yes — when the existing tool genuinely doesn't fit your domain. But often the answer is: do you understand what you're competing against? Not the code. The engineering hours behind the code.
This is the real lesson of the dyno test.
The pattern to keep
The compiled delegate pattern, though — that's worth keeping. It's not EF Core-specific. Anywhere you use reflection in a hot path — serializers, mappers, validation frameworks, configuration binders — you can replace PropertyInfo.GetValue/SetValue with a compiled lambda and see the same 50x improvement per property access.
I use it in production code regularly. Not in ORMs — I use EF Core for that. But in custom serializers, audit loggers, and domain event dispatchers where reflection was the bottleneck. At a financial services platform, I used this exact pattern to speed up a claim-to-DTO mapper from 12ms to 0.4ms per batch — the profiler showed that reflection in the mapper was burning more CPU than the database query that fed it. One afternoon of refactoring, 30x faster.
The pattern always works, and the speedup is always dramatic.
// The generalized pattern: one-time compile, cached reuse
var getter = PropertyAccessorCompiler.CompileGetter<T>(prop);
var value = getter(entity);  // ~2ns instead of ~100ns
Tomorrow's the last chapter of Week 1. We'll step back from the code and ask: what did building an ORM from scratch actually teach me about using the one I'll go back to on Monday?
Here's a challenge before you move on. Find a hot path in your own codebase that uses reflection — a mapper, a serializer, a configuration binder. Profile it. Then replace the PropertyInfo.GetValue/SetValue calls with compiled delegates using the PropertyAccessorCompiler pattern above. Measure again.
The speedup will surprise you. And it'll teach you more about the cost of abstraction than any benchmark table I could publish here.