
Every Codebase I've Ever Touched Followed the Same Growth Curve
A software naturalist's first field observation — why codebases grow, plateau, and resist change in patterns that biology mapped two centuries ago.

In 1838, a Belgian mathematician named Pierre-François Verhulst was trying to solve a population puzzle. If rabbits reproduced without constraint — each pair producing another pair each generation — you'd get exponential growth. Within a few decades, the planet would be waist-deep in rabbits. Obviously, this doesn't happen. Something limits the growth. Verhulst spent years working out the equation for what that limit looks like.
What he discovered was beautifully simple. Growth starts fast, then slows as the population approaches a ceiling he called the carrying capacity — the maximum number a given environment can sustain. Plot it on a graph and you get an S-shaped curve. Steep at the bottom, flattening at the top. The growth doesn't stop because the organisms stop trying. It stops because the environment runs out of capacity to support more.
Every ecologist since has confirmed this pattern. Bacteria in a petri dish. Deer in a forest. Trees colonizing an abandoned field. The S-curve is one of the most reliable shapes in biology.
Every codebase I've ever touched follows the same growth curve. The same S-shape. The same initial explosion, the same gradual flattening, the same late-stage resistance to change. After the third or fourth system that behaved identically — from a photo studio in Puglia to a scheduling platform spanning three countries — I stopped being surprised and started paying closer attention.
The Software Naturalist is a series built on that attention. The premise: production software exhibits phenomena — predictable, measurable behaviors — that we can study the way naturalists study living systems. Not with the goal of building another framework, but with the goal of understanding why software behaves the way it does.
Let's start with the growth curve.
The first year: pioneer species
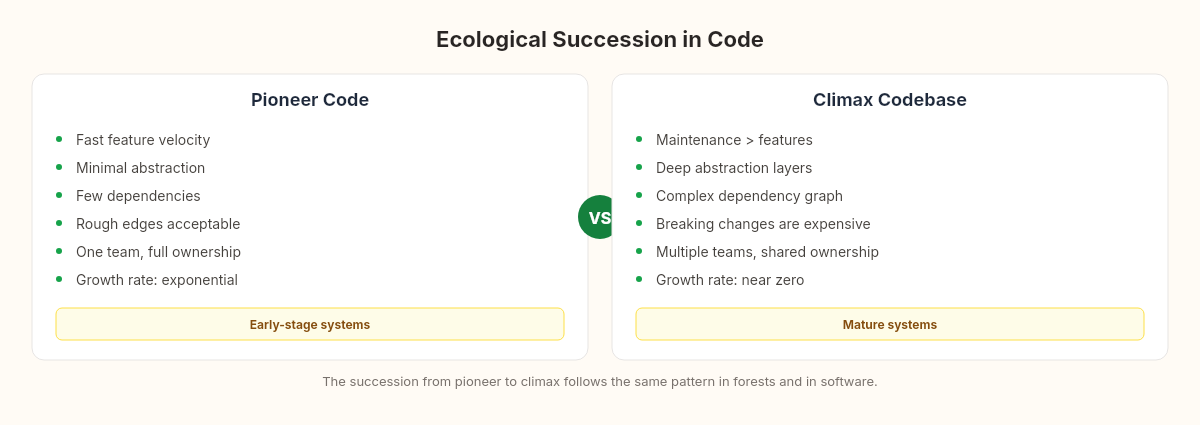
Ecologists have a term for the first organisms to colonize an empty landscape. After a forest fire or a volcanic eruption clears the ground, certain species arrive first — mosses, lichens, fast-growing grasses. Ecologists call them pioneer species. They share a set of characteristics: they grow fast, tolerate harsh conditions, require minimal infrastructure, and don't last long. They prepare the soil for what comes next.
I've started enough projects from scratch to recognize the software equivalent. The first year of a codebase is pioneer code.
In 2005, I built my first production system — a client-server application for a photo studio in Puglia. One developer. No framework. No Stack Overflow (it wouldn't launch for another three years). Just MSDN documentation, C#, and the absolute freedom of an empty canvas.
The growth was explosive. Features shipped daily. The architecture was simple because there wasn't time for architecture — a web layer, a database, and as few abstractions as possible between them. Dependencies were minimal. Build time was seconds. Every decision was local. If something needed to change, I changed it. There was no pull request process because there was no pull request reviewer. There was no deployment pipeline because the pipeline was me copying files.
This is what pioneer code looks like:
Feature velocity is at its lifetime maximum
Abstractions are minimal — code is concrete, direct, pragmatic
Dependencies are few
One person (or a very small team) holds the entire system in their head
Technical debt accumulates freely, but nobody notices because the cost is invisible
The growth rate during the pioneer phase follows the steep initial segment of Verhulst's S-curve. Fast, accelerating, seemingly unlimited. If you plotted files created per month, commits per week, or features shipped per sprint, the line would go up and to the right with a conviction that feels permanent.
It isn't.
The carrying capacity of code
Verhulst's equation has a critical variable: K, the carrying capacity. In biology, K is determined by the environment — available food, water, shelter, territory. In a codebase, K is determined by something subtler: the maximum complexity that the current architecture, team, and tooling can sustain.
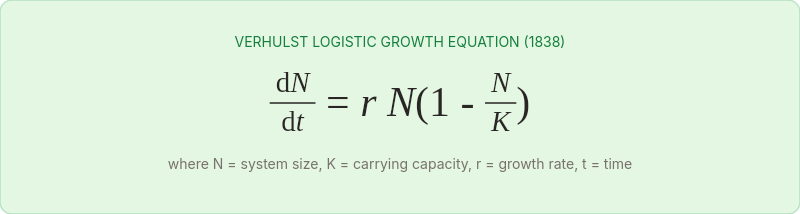
In that equation, N is the current size, r is the growth rate, and K is the ceiling. The critical term is the growth limiter:

When N is small relative to K, this term is close to 1 and growth is nearly exponential. As N approaches K, the term shrinks toward zero, and growth stalls.
What determines K in a codebase?
Architectural capacity. A single-project monolith has a lower K than a well-modularized solution. The monolith's carrying capacity is limited by compilation time, merge conflicts, and the cognitive overhead of navigating a single massive namespace. When N reaches about 60-70% of K, developers start reporting that "everything takes longer than it should." They're right. The system is approaching its architectural ceiling.
Team capacity. Fred Brooks observed this in 1975: adding people to a late project makes it later. The communication overhead scales combinatorially — each new team member must coordinate with every existing member.

A three-person team has 3 communication channels. A ten-person team has 45. The team's carrying capacity for a single codebase has a hard limit, and it's lower than most organizations want to believe.
Tooling capacity. Build systems, CI/CD pipelines, test suites — they all have throughput ceilings. When a test suite takes 40 minutes to run, developers start skipping it. When the build takes 5 minutes, developers batch their changes into larger commits. The tooling infrastructure imposes its own K on the system's growth rate.
Cognitive capacity. Perhaps the most important and least measurable. How much of the system can any single developer hold in their head? In the pioneer phase, one person understood everything. By the time the codebase reaches its carrying capacity, nobody understands everything. Each developer holds a fragment. The system's behavior becomes an emergent property of partial comprehensions, and that emergence isn't always benign.
The carrying capacity isn't a number you set. It's a number you discover — usually after you've already exceeded it.
The man who studied software like a naturalist
In 1974, a computer scientist named Meir Lehman was doing something unusual at IBM. Instead of building software, he was watching software. Specifically, he was observing how IBM's OS/360 operating system evolved over time — tracking changes, measuring growth, counting modifications across releases.
This was radical. In 1974, software engineering was barely a decade old as a discipline. The prevailing assumption was that software was designed — you planned it, built it, and maintained it. Lehman proposed something different: software evolves, and that evolution follows measurable, repeatable laws.
Over the next two decades, Lehman and his colleague Les Belady identified eight laws of software evolution. They weren't guidelines or best practices. They were empirical observations — patterns that appeared consistently across every large system they studied.
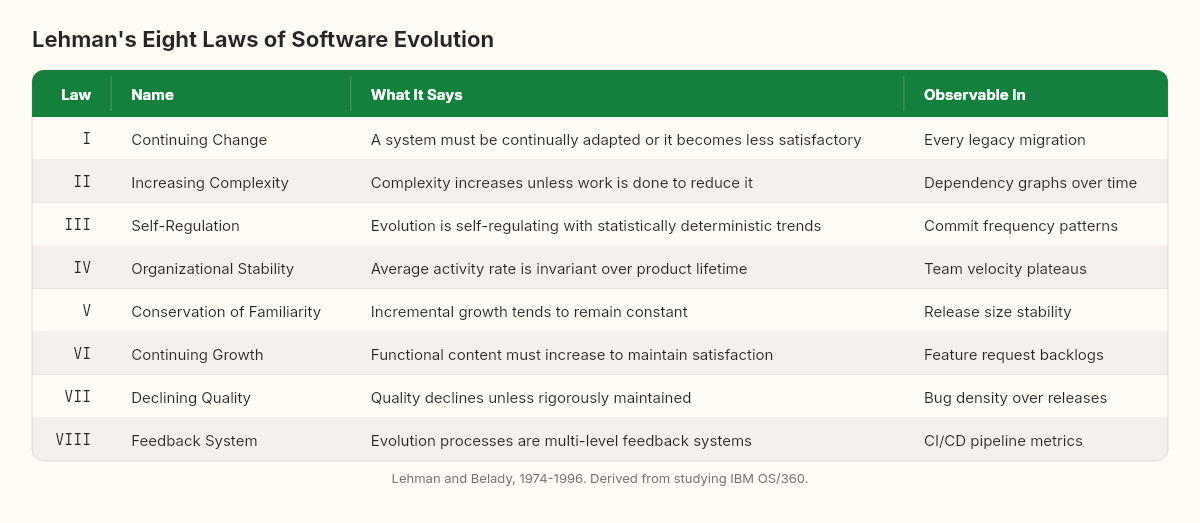
The laws fall into three categories that map neatly onto biological ecology:
Growth laws (I, VI): A system must continuously change to remain useful, and its functional content must continuously increase. This is the logistic growth curve in action — the system grows because its environment (user needs, competitive pressure, regulatory requirements) demands growth. Stasis isn't stable. A codebase that stops growing starts dying.
Complexity laws (II, VII): As the system evolves, complexity increases unless active work is done to reduce it. Quality declines unless rigorously maintained. This is the thermodynamic arrow — entropy increases in any closed system. In biology, organisms expend enormous energy just maintaining existing structures. A human body replaces billions of cells daily not to grow, but to avoid decay. Codebases require the same metabolic investment.
Self-regulation laws (III, IV, V, VIII): Growth rates stabilize. Team activity rates become statistically invariant. Incremental releases stay roughly constant in size. The system develops its own homeostasis — a tendency to resist perturbation and maintain stable patterns. This is the biological concept of equilibrium. A mature ecosystem settles into a dynamic balance that resists disruption.
What struck me when I first read Lehman's work wasn't the laws themselves — any experienced developer has felt all eight of them. What struck me was the method. Lehman didn't theorize about software. He observed it. He measured it. He treated a running system as a natural phenomenon to be studied, not a product to be managed.
That's the spirit behind this series.
Ecological succession in code
In ecology, the process by which a landscape transitions from pioneer species to a stable, mature ecosystem is called succession. Primary succession starts from bare rock. Secondary succession starts from a disturbed but not destroyed ecosystem. Both follow the same general arc: fast-growing generalists give way to slow-growing specialists, complexity increases, nutrient cycling becomes more efficient, and the system eventually reaches a climax community — a relatively stable state where the rate of new growth roughly equals the rate of decay.
I've watched this succession happen in five codebases across four countries. The timeline varies — some systems reach climax in three years, others take a decade — but the phases are remarkably consistent.
Phase 1: Colonization (months 0–12). The pioneer phase. Rapid feature growth. Minimal architecture. Small team with full system comprehension. Technical debt is invisible because the system is small enough to rewrite on a bad weekend. Dependencies are few and deliberately chosen. The codebase feels alive in a way that experienced developers recognize and miss.
Phase 2: Establishment (years 1–3). The growth rate is still positive but decelerating. The first abstractions appear — not because someone read a book about clean architecture, but because the code demands them. Patterns emerge from repetition. The team grows. Code reviews begin. The first "why was this built this way?" questions surface. Build times lengthen. The first flaky test appears.
Phase 3: Competition (years 3–5). Resources become scarce. Not physical resources — organizational attention. Teams compete for refactoring time. New features compete with maintenance. The dependency graph thickens. Module boundaries blur. Cross-cutting concerns (logging, auth, error handling) that were ad hoc in the pioneer phase now need standardization, and the standardization effort reveals how much inconsistency accumulated during fast growth.
This is the phase where most organizations first use the phrase "technical debt" seriously. They're not wrong, but the biological frame is more precise: the system has reached a successional stage where generalist solutions are being replaced by specialist ones, and the transition is expensive.
Phase 4: Climax (year 5+). Growth slows to near-zero. New features require more effort to integrate than they did to build. The system's primary consumers of engineering time are maintenance, compliance, security patches, and dependency updates. Major structural changes feel dangerous — not because the engineers are timid, but because the dependency web has reached a density where any significant change propagates unpredictably.
The climax community isn't dead. It's stable. A mature forest isn't growing new trees at the rate a young forest does, but it's cycling nutrients, supporting biodiversity, and maintaining itself through continuous small adaptations. A climax codebase does the same.
Five codebases, one curve
I can't share the exact data — privacy agreements and the fact that I'd need git access to systems I left years ago — but I can share the patterns I observed, abstracted across five production codebases spanning 2005 to 2025.
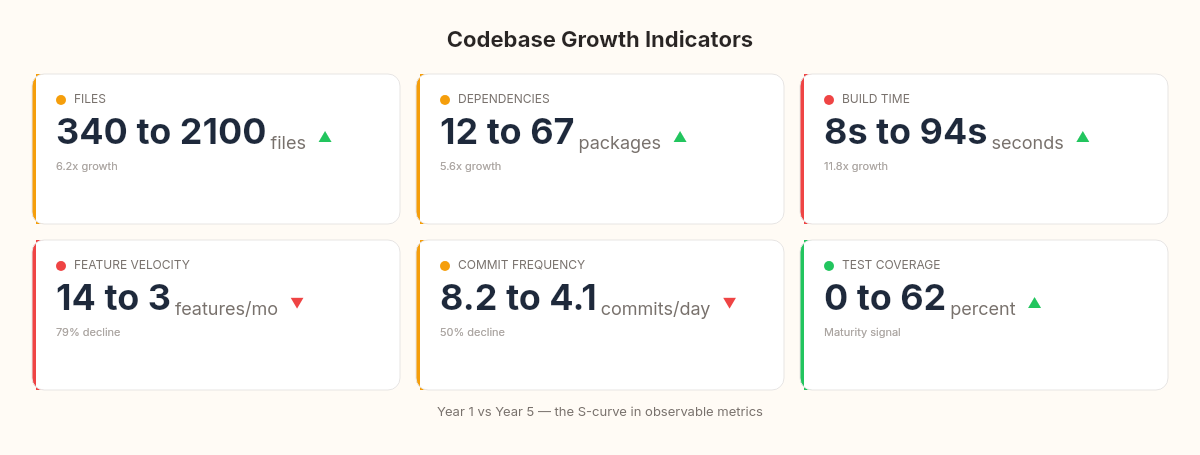
Files. Every codebase I've worked with shows a burst of file creation in the first 12-18 months, followed by a sharp decline. The decline doesn't mean nothing is happening — it means new features are being added to existing files, not new ones. This mirrors ecological succession perfectly: pioneer species create new biomass rapidly, while climax communities recycle existing biomass.
Dependencies. External package references follow a steeper S-curve than file counts. In one system — a scheduling platform for a major utility — we went from 12 NuGet packages to 67 in three years. The dependency growth correlated almost perfectly with the system's transition from Phase 2 (establishment) to Phase 3 (competition). By year four, every new dependency required a formal review process, not because we were being bureaucratic, but because each new package interacted with so many existing ones that the blast radius of a breaking change was genuinely unpredictable.
Build time. Perhaps the most visceral indicator. In the pioneer phase, builds are measured in seconds. By the climax phase, they're measured in minutes — sometimes many minutes. Build time is the codebase's metabolic rate. A fast build means the system is small enough to recompile cheaply. A slow build means the system has accumulated enough mass that even checking whether things are consistent requires significant computation.
Feature velocity. This is the metric that causes the most organizational distress. Teams that shipped 14 features per month in the pioneer phase find themselves shipping 3 per month in the climax phase — and they blame the developers, the architecture, or the process. Almost never do they blame the phase. The system isn't slow because something is wrong. It's slow because it's mature. The equivalent complaint in ecology would be wondering why a 200-year-old oak tree isn't growing as fast as a sapling.
Commit frequency. A rough proxy for development intensity. Pioneer codebases show 8-10 commits per day. Climax codebases show 3-5 commits per day, but each commit is larger and more carefully reviewed. The total volume of change may be similar — the character of the change shifts from additive to modifying.
Measuring where you are
One of the advantages of treating codebase growth as a natural phenomenon is that natural phenomena can be measured. Here's how to determine where your system sits on the growth curve.
Commit archaeology. Git preserves the entire fossil record of your codebase. A simple analysis of commits per month over the project's lifetime will reveal the S-curve — if it exists — in your own data.
# Commits per month over the project's lifetime
git log --format='%ad' --date=format:'%Y-%m' | sort | uniq -c | sort -k2
Plot the output. If your codebase is past the pioneer phase, you'll see the characteristic deceleration. The inflection point — where the curve stops accelerating and starts decelerating — marks your system's transition from pioneer to establishment phase.
File creation rate. New files per month is a direct measure of structural expansion:
# New files created per month
git log --diff-filter=A --format='%ad' --date=format:'%Y-%m' --name-only | \
  grep -E '^\d{4}-\d{2}$' | sort | uniq -c | sort -k2
When the file creation rate drops below the file modification rate, your codebase has entered the climax phase. New structure is no longer being added — existing structure is being adapted.
Dependency growth. Track your package references over time. In .NET, you can extract this from your .csproj files across git history:
# Count PackageReference entries at each quarterly tag
for tag in $(git tag --sort=version:refname); do
  count=$(git show "$tag:src/MyProject/MyProject.csproj" 2>/dev/null | \
    grep -c 'PackageReference' || echo 0)
  echo "$tag: $count packages"
done
The K-estimation heuristic. If you want a rough estimate of your codebase's carrying capacity, look at the ratio of feature-related commits to maintenance-related commits over the last 12 months. When maintenance exceeds 60% of total activity, you're likely past 80% of K. The system is spending more energy on self-maintenance than on growth — exactly like a climax ecosystem.
// A simplified model — not production code, but illustrative
public record CodebaseMetrics(
    int TotalFiles,
    int FilesCreatedLastMonth,
    int FilesModifiedLastMonth,
    int ExternalDependencies,
    double BuildTimeSeconds,
    int CommitsPerWeek)
{
    public double GrowthRatio =>
        FilesCreatedLastMonth / (double)Math.Max(FilesModifiedLastMonth, 1);

    public string Phase => GrowthRatio switch
    {
        > 1.0 => "Pioneer — rapid structural expansion",
        > 0.3 => "Establishment — still growing, decelerating",
        > 0.1 => "Competition — growth vs. maintenance tension",
        _     => "Climax — maintenance-dominated"
    };
}
The thresholds are approximate. Every system has its own K, shaped by its architecture, team, and tooling. But the ratios are consistent enough that I'd bet a dinner on them.
The limits of the logistic model
A good naturalist names the limits of the observation. The growth curve model is descriptive, not prescriptive. It tells you what will happen, not what to do about it.
The model doesn't account for architectural interventions. A well-timed modularization — splitting a monolith into bounded contexts, or extracting a service — can raise K significantly. This is the codebase equivalent of ecological engineering: building a dam that creates new habitat and raises the landscape's carrying capacity. These interventions are real and valuable. But they're expensive, and the new architecture will follow its own S-curve toward a new, higher K.
The model doesn't explain why some systems resist succession. Some codebases stay in the pioneer phase for years — usually because the team is small, the scope is narrow, and the environment is stable enough that growth pressure remains low. A microservice with a single responsibility and a two-person team may never leave the colonization phase. That's fine. Not every meadow becomes a forest.
The model treats the codebase as isolated. In reality, modern systems are ecosystems of interconnected services, shared libraries, and platform dependencies. The growth curve of the whole system may follow the S-shape even when individual components are at different successional stages. The interaction effects between components at different stages — a pioneer service depending on a climax service's API — create dynamics that Verhulst's equation doesn't capture.
Not every observation needs to explain everything. Sometimes the value is in naming what you see, so you can stop being surprised by it.
What the S-curve rewrites about velocity, debt, and rewrites
If codebase growth follows the same logistic curve that governs rabbit populations and forest succession, several things follow.
Declining velocity is not a failure. It's a phase transition. The most corrosive belief in software organizations is that slowing feature delivery means something is broken — the engineers are lazy, the architecture is wrong, the process is bad. Sometimes those things are true. But often, the system has simply reached the decelerating segment of its S-curve. Recognizing the phase doesn't remove the problem, but it changes the response from "fix what's broken" to "adapt to where we are."
Technical debt is metabolism. In the pioneer phase, organisms grow fast and don't invest heavily in maintenance. In the climax phase, maintenance is the primary activity. This isn't a pathology — it's the natural cost of existing at a certain scale. Teams that budget 30-40% of their time for maintenance in a climax codebase aren't underperforming. They're paying the metabolic cost of a mature system.
Rewrites are succession restarts. When an organization decides to rewrite a system from scratch, they're performing ecological disturbance — clearing the climax community and starting fresh. Secondary succession proceeds faster than primary succession (you have the old system's knowledge), but the new system will follow its own S-curve. The question isn't whether the rewrite will eventually reach a climax phase. It will. The question is whether K is higher this time — whether the new architecture can sustain a larger, more complex system before growth stalls again.
Microservices are habitat fragmentation. Breaking a monolith into microservices is, in ecological terms, fragmenting a single large habitat into multiple small ones. Each fragment has its own K, its own succession path, its own growth curve. This can be beneficial — the way nature reserves create protected ecosystems. But fragmentation also creates edge effects, reduces connectivity, and makes it harder for the whole system to respond to large-scale changes. The ecological literature on habitat fragmentation is remarkably relevant to microservice architecture, and almost nobody reads it.
Hiring doesn't raise K. Adding developers to a codebase that's at its carrying capacity is like introducing more rabbits into an environment that's already at K. The population doesn't grow — it just experiences more competition for the same resources. What raises K is changing the environment: better tooling, clearer module boundaries, architectural refactoring that creates new capacity for growth. Brooks knew this. Verhulst's equation explains why Brooks was right.
Observing before optimizing
I started this series with a growth curve because it's the most visible phenomenon in software — and the most misunderstood. We build systems. We watch them grow. We watch them slow down. And we react as if each slowdown is a surprise, a problem to be solved, rather than a predictable phase in a life cycle that biology mapped two centuries ago.
The naturalist's stance is different from the engineer's stance. The engineer asks: how do I fix this? The naturalist asks: what am I seeing, and does it follow a pattern? Both questions are valuable. But the second question comes first. You can't fix what you haven't understood, and you can't understand something you haven't bothered to observe.
Lehman understood this. He sat in IBM's offices in the 1970s and watched OS/360 evolve, and instead of trying to manage the evolution, he tried to understand it. What he found were laws — not rules you could break, but patterns you could see if you looked carefully enough.
I'm not Lehman. But I've had the privilege of watching software systems grow and age and sometimes die across two decades and four countries. This series is what I've seen — the patterns I keep finding, the science that keeps explaining them, and the question that keeps returning.
If a codebase is an ecosystem, governed by growth laws and carrying capacities and successional phases — what does it mean to be a good steward of one?
The next article in the series investigates a related phenomenon: why systems don't degrade gracefully but instead break at specific, predictable thresholds. The physics of phase transitions — when water becomes ice not gradually but all at once — turns out to explain why your system was fine at 800 requests per second and collapsed at 850.