
Stress-Testing CQRS — 5,000 Commands Per Second and a Lagging Read Model
The blueprint works. The edge cases are handled. Now we throw 5,000 concurrent commands at the system and watch the projection lag grow. Every architecture has a resonant frequency. We're about to find ours.

3,200 commands per second. That's where it breaks.
Not crashes. Not exceptions. Not timeouts. The system keeps running. Commands keep processing. Events keep publishing. But at 3,200 commands per second, the projection handler falls behind. The gap between write and read — the eventual consistency window — starts growing instead of recovering. At 3,500 cmd/s, the read model is 2 seconds behind. At 4,000, it's 8 seconds. At 5,000, it's 47 seconds and climbing.
The system is architecturally correct and operationally failing.
Resonant frequency
In 1940, the Tacoma Narrows Bridge collapsed four months after opening. The wind that day was only 42 mph — well within the bridge's design load. The problem wasn't force. It was frequency. The wind's oscillation happened to match the bridge's natural resonant frequency, causing the deck to amplify its own vibrations until the structure tore itself apart.
Every physical structure has a resonant frequency — a specific input rate that causes disproportionate damage. Below it, the system absorbs and dissipates. Above it, the system fails catastrophically. Not gradually. Not proportionally. The response curve is a cliff.

Software systems have the same property. There's a command rate where the projection handler's processing speed exactly matches the event production rate — the system is at capacity but stable. Push slightly beyond that rate and the backlog doesn't just grow linearly. It compounds. Each unprocessed event adds to the queue, which adds latency to subsequent processing, which further increases the backlog.
We built the CQRS system in the blueprint chapter. We cataloged the edge cases in the previous article about CQRS edge cases. Now we find its resonant frequency.
The test harness
public class CqrsLoadTest
{
    private readonly ICommandDispatcher _dispatcher;
    private readonly OrderReadStore _readStore;
    private readonly Stopwatch _stopwatch = new();
    private readonly ConcurrentBag<CommandResult> _results = new();

    public async Task RunAsync(int commandsPerSecond, int durationSeconds)
    {
        var interval = TimeSpan.FromMilliseconds(1000.0 / commandsPerSecond);
        var cts = new CancellationTokenSource(
            TimeSpan.FromSeconds(durationSeconds));

        _stopwatch.Start();

        var tasks = new List<Task>();
        while (!cts.IsCancellationRequested)
        {
            tasks.Add(SendCommandAsync());
            await Task.Delay(interval, cts.Token).ConfigureAwait(false);
        }

        await Task.WhenAll(tasks);
        _stopwatch.Stop();
    }

    private async Task SendCommandAsync()
    {
        var cmd = new CreateOrderCommand
        {
            CustomerId = Guid.NewGuid(),
            ShippingCity = "Test",
            ShippingAddress = "Load Test Lane",
            Items = new List<OrderItemDto>
            {
                new(Guid.NewGuid(), 1, 9.99m)
            }
        };

        var sw = Stopwatch.StartNew();
        var orderId = await _dispatcher.DispatchAsync(cmd);
        sw.Stop();

        _results.Add(new CommandResult
        {
            OrderId = orderId,
            CommandLatency = sw.Elapsed,
            Timestamp = _stopwatch.Elapsed
        });
    }
}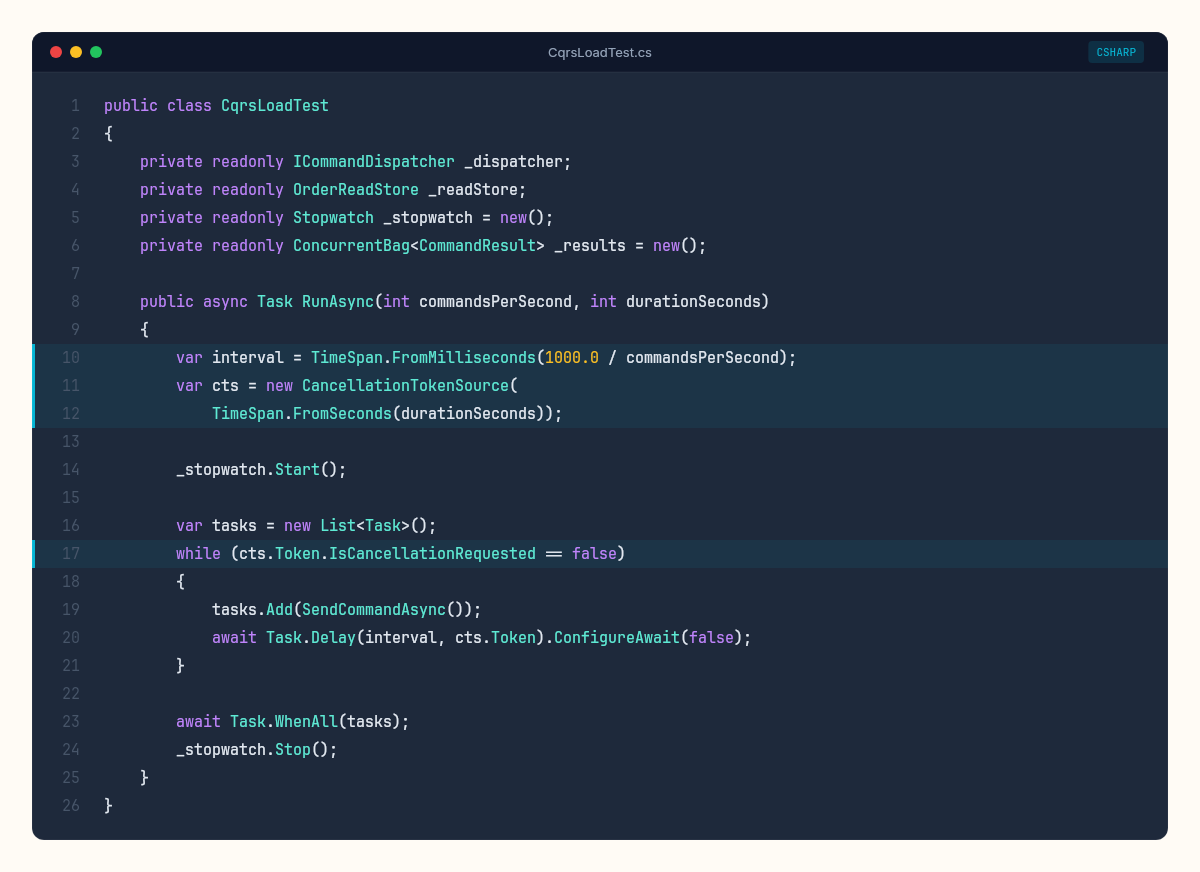
The harness fires commands at a controlled rate and records the latency of each one. After the test completes, a separate pass measures the projection lag: for each written order, how long until it appears in the read model?
public async Task<ProjectionLagResult> MeasureProjectionLagAsync(
    List<CommandResult> commands)
{
    var lags = new List<TimeSpan>();

    foreach (var cmd in commands.TakeLast(100)) // sample recent commands
    {
        var sw = Stopwatch.StartNew();
        OrderSummary? summary = null;

        while (summary == null && sw.Elapsed < TimeSpan.FromSeconds(60))
        {
            summary = await _readStore.GetByIdAsync(cmd.OrderId);
            if (summary == null)
                await Task.Delay(10);
        }

        sw.Stop();
        lags.Add(sw.Elapsed);
    }

    return new ProjectionLagResult
    {
        P50 = lags.OrderBy(l => l).ElementAt(lags.Count / 2),
        P95 = lags.OrderBy(l => l).ElementAt((int)(lags.Count * 0.95)),
        P99 = lags.OrderBy(l => l).ElementAt((int)(lags.Count * 0.99)),
        Max = lags.Max()
    };
}
The results
We run the test at increasing command rates: 500, 1000, 2000, 3000, 4000, and 5000 commands per second. Each test runs for 30 seconds. Single PostgreSQL instance, write store and read store in the same database, projection handler running in-process.
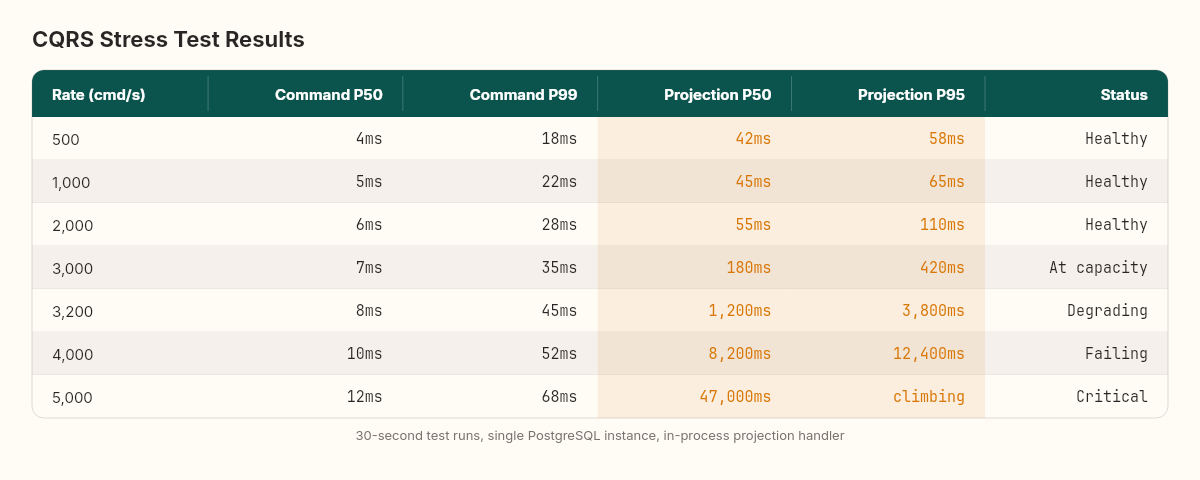
The pattern is clear. Up to 2,000 cmd/s, the projection handler keeps up. The lag is stable at 40-60ms — essentially the time to process one event through the projection pipeline. The system is below its resonant frequency.
At 3,000 cmd/s, the lag starts climbing. Not dramatically — 180ms at P50, 420ms at P95. The projection handler is at capacity. Some events queue briefly, then get processed. The system recovers between bursts.
At 3,200 cmd/s, the lag stops recovering. Each measurement is higher than the last. The queue grows monotonically. This is the resonant frequency — the rate where production exceeds consumption and the backlog compounds.
3,200 commands per second is where eventual becomes too eventual. Not a hard failure — a soft one. The kind that shows up in user complaints, not error logs.
At 5,000 cmd/s, the projection lag reaches 47 seconds by the end of the 30-second test and is still climbing. A user placing an order would wait nearly a minute to see it in their dashboard. The write side is fine — command latency stays under 15ms at P50. The bottleneck is entirely in the projection pipeline.
Metrics dashboard
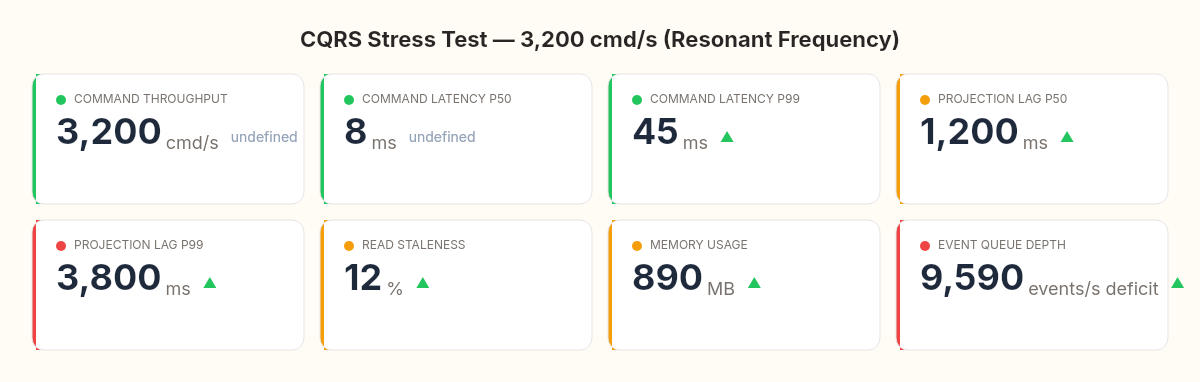
The dashboard at 3,200 cmd/s tells the full story:
Command throughput: 3,200 cmd/s (write side healthy)
Command latency P50: 8ms (fast)
Command latency P99: 45ms (acceptable)
Projection lag P50: 1,200ms (problematic)
Projection lag P99: 3,800ms (unacceptable for real-time UI)
Read staleness: 12% of reads return data >2s old
Memory: 890MB (projection event buffer growing)
Where the bottleneck lives
The projection handler processes events sequentially — one at a time, in order. Each event triggers a database read (fetch existing summary), a transformation, and a database write (upsert). At roughly 3ms per event, the theoretical maximum is ~330 events per second.
But commands can generate multiple events. A CreateOrderCommand with three items produces four events: OrderCreated + three OrderItemAdded. At 3,200 commands per second, the event rate is closer to 10,000 events per second. The projection handler, processing at 330 events/second, falls behind by a factor of 30.
Command rate:       3,200 cmd/s
Events per command: ~3.1 (average)
Event rate:         ~9,920 events/s
Projection speed:   ~330 events/s
Deficit:            ~9,590 events/s accumulating in queue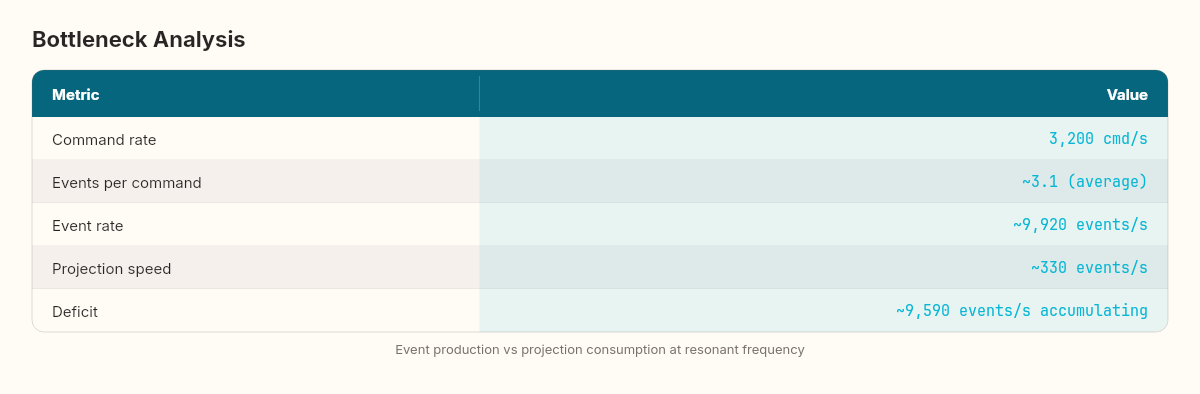
Three paths to higher throughput
Path 1: Batch projection updates — Instead of one database round-trip per event, batch 100 events and execute a single multi-row upsert. Reduces the per-event cost from 3ms to ~0.1ms. Theoretical ceiling: ~10,000 events/second.
public async Task HandleBatchAsync(IReadOnlyList<IDomainEvent> events)
{
    var updates = new Dictionary<Guid, OrderSummary>();

    foreach (var evt in events)
    {
        var id = evt.AggregateId;
        if (!updates.ContainsKey(id))
            updates[id] = await _readStore.GetByIdAsync(id)
                ?? new OrderSummary { OrderId = id };

        ApplyEvent(updates[id], evt);
    }

    await _readStore.BulkUpsertAsync(updates.Values);
}
Path 2: Parallel projections — Partition events by aggregate ID and run multiple projection instances in parallel. Events for the same aggregate stay ordered; events for different aggregates process concurrently.
Path 3: Separate read database — Move the read store to a dedicated PostgreSQL instance (or Redis, or Elasticsearch). Eliminates contention between write-side transactions and read-side upserts.
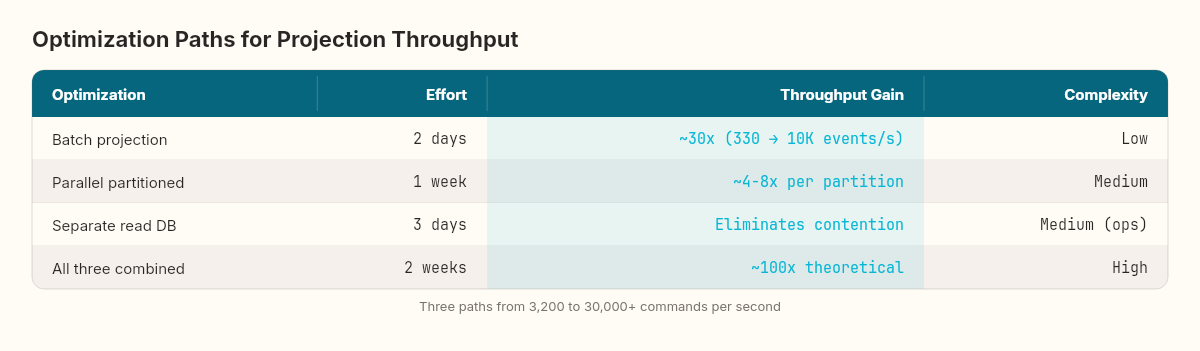
The batch approach alone pushes the resonant frequency from 3,200 to roughly 30,000 commands per second. For most applications, that's sufficient. The parallel and separate-database approaches are for systems that genuinely need to sustain tens of thousands of writes per second — financial trading platforms, real-time analytics ingestion, high-frequency IoT telemetry.
What we didn't measure
Three things this stress test doesn't capture:
Recovery time. After the load spike ends, how long does the projection handler take to drain the queue and return to real-time? At 5,000 cmd/s for 30 seconds, we accumulated roughly 150,000 events. At 330 events/second processing speed, the recovery takes over 7 minutes. With batching, under 15 seconds.
Multi-tenant contention. Our test uses random customer IDs. A real system might have hot aggregates — one customer placing hundreds of orders — where the sequential processing guarantee within an aggregate creates additional bottlenecks.
Cascading effects. A lagging read model doesn't just produce stale UIs. If other services poll the read model for decision-making (should we restock? should we send a shipping notification?), projection lag cascades into delayed business processes.
The number that matters
3,200. That's our system's resonant frequency with the current architecture. Below it, CQRS works as advertised — fast writes, fast reads, acceptable lag. Above it, the projection pipeline becomes a bottleneck that grows without bound.
Every CQRS system has this number. Most teams don't know theirs until production teaches them. The stress test cost us an afternoon. The production incident it prevents would cost much more.
3,200. That's not a universal constant — it's a measurement specific to this architecture, this database, this projection pipeline. Every system has its own resonant frequency. The teams that find it in a test harness sleep better than the ones who discover it from a support ticket at 2 AM.